This page shows comparative election results of political parties that contested National Assembly seats in General Election 2008.
| Previous Election 2002 | Current Election 2008 |
|---|
| Party Position | Party Name | Symbol | Flag | Manifesto | Previous Election 2002 | Seat Won | Votes | % Vote Share | Current Election 2008 | Seat Won | Votes | % Vote Share | % Vote Change |
|---|---|---|---|---|---|---|---|---|---|---|---|---|---|
| 1 | Pakistan Peoples Party Parliamentarians (PPPP) |
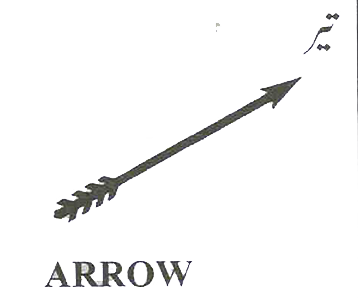
|

|
63 | 7,616,033 | 26 | 89 | 10,666,548 | 31 | +40.05 | |||
| 2 | Pakistan Muslim League (PML) |

|

|
78 | 7,500,797 | 26 | 42 | 7,962,473 | 23 | +6.16 | |||
| 3 | Pakistan Muslim League (Nawaz) (PML-N) |

|

|
15 | 3,409,805 | 12 | 68 | 6,917,752 | 20 | +102.88 | |||
| 4 | Independent (IND) |

|

|
28 | 2,722,669 | 9 | 30 | 3,826,490 | 11 | +40.54 | |||
| 5 | Muttahidda Qaumi Movement (MQM-Pakistan) |
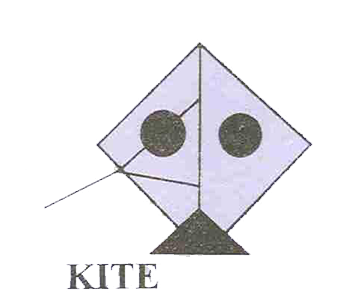
|

|
13 | 932,166 | 3 | 19 | 2,573,795 | 7 | +176.11 | |||
| 6 | Muttahidda Majlis-e-Amal Pakistan (MMA) |
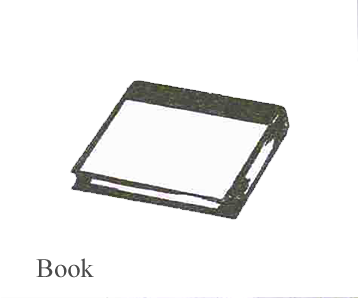
|

|
45 | 3,335,643 | 11 | 6 | 769,638 | 2 | -76.93 | |||
| 7 | Awami National Party (ANP) |
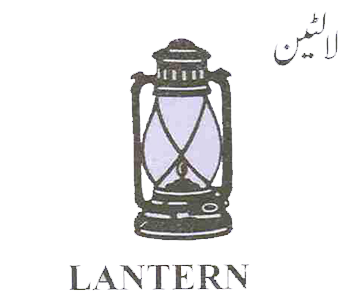
|

|
|
299,067 | 1 | 10 | 704,811 | 2 | +135.67 | |||
| 8 | Pakistan Muslim League (Functional) (PML-F) |
|

|
4 | 328,923 | 1 | 4 | 685,684 | 2 | +108.46 | |||
| 9 | National Peoples Party (NPP) |

|

|
0 | 1 | 148,892 | 0 | ||||||
| 10 | Pakistan Peoples Party (Sherpao) (PPP-S) |
|
|
2 | 98,476 | 0 | 1 | 141,975 | 0 | +44.17 |
