This page shows comparative election results of political parties that contested National Assembly seats in General Election 2013.
| Previous Election 2008 | Current Election 2013 |
|---|
| Party Position | Party Name | Symbol | Flag | Manifesto | Previous Election 2008 | Seat Won | Votes | % Vote Share | Current Election 2013 | Seat Won | Votes | % Vote Share | % Vote Change |
|---|---|---|---|---|---|---|---|---|---|---|---|---|---|
| 1 | Pakistan Muslim League (Nawaz) (PML-N) |

|

|
|
68 | 6,917,752 | 20 | 126 | 14,894,452 | 33 | +115.31 | ||
| 2 | Pakistan Tehreek-e-Insaf (PTI) |
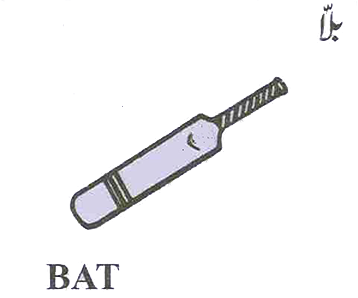
|

|
|
0 | 28 | 7,747,383 | 17 | |||||
| 3 | Pakistan Peoples Party Parliamentarians (PPPP) |
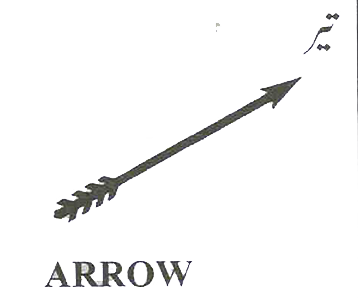
|

|
|
89 | 10,666,548 | 31 | 34 | 7,060,574 | 15 | -33.81 | ||
| 4 | Independent (IND) |

|

|
30 | 3,826,490 | 11 | 29 | 5,988,623 | 13 | +56.5 | |||
| 5 | Muttahidda Qaumi Movement (MQM-Pakistan) |
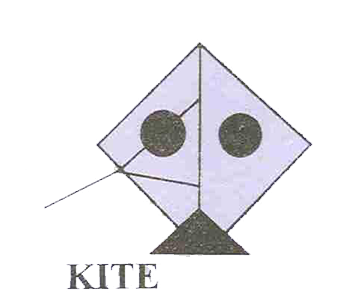
|

|
|
19 | 2,573,795 | 7 | 18 | 2,458,918 | 5 | -4.46 | ||
| 6 | Jamiat Ulama-e-Islam (Fazal Ur Rehman) (JUI) |
|

|
0 | 11 | 1,486,744 | 3 | ||||||
| 7 | Pakistan Muslim League (PML) |
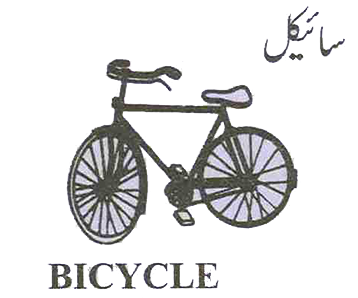
|

|
|
42 | 7,962,473 | 23 | 2 | 1,410,113 | 3 | -82.29 | ||
| 8 | Pakistan Muslim League (Functional) (PML-F) |
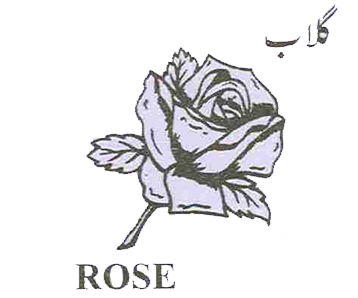
|

|
4 | 685,684 | 2 | 5 | 1,072,846 | 2 | +56.46 | |||
| 9 | Jamaat-e-Islami Pakistan (JI) |
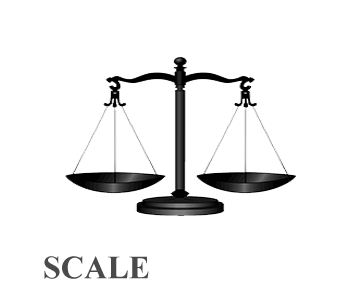
|

|
|
0 | 3 | 967,651 | 2 | |||||
| 10 | Awami National Party (ANP) |

|
|
|
10 | 704,811 | 2 | 1 | 453,769 | 1 | -35.62 |
