This page shows comparative election results of political parties that contested Punjab Assembly seats in General Election 2018.
| Previous Election 2013 | Current Election 2018 |
|---|
| Party Position | Party Name | Symbol | Flag | Manifesto | Previous Election 2013 | Seat Won | Votes | % Vote Share | Current Election 2018 | Seat Won | Votes | % Vote Share | % Vote Change |
|---|---|---|---|---|---|---|---|---|---|---|---|---|---|
| 1 | Pakistan Tehreek-e-Insaf (PTI) |
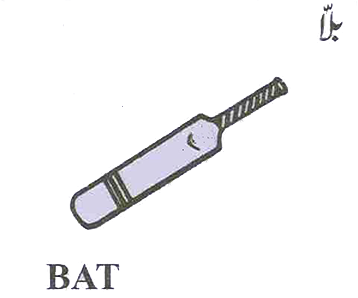
|

|
|
20 | 0 | 121 | 0 | |||||
| 2 | Pakistan Muslim League (Nawaz) (PML-N) |

|
|
|
212 | 0 | 130 | 0 | |||||
| 3 | Independent (IND) |

|

|
42 | 0 | 30 | 0 | ||||||
| 4 | Tehreek-e-Labaik Pakistan (TLP) |

|

|
0 | 0 | ||||||||
| 5 | Pakistan Peoples Party Parliamentarians (PPPP) |
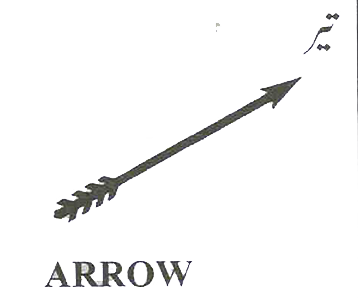
|

|
|
6 | 0 | 7 | 0 | |||||
| 6 | Muttahidda Majlis-e-Amal Pakistan (MMA) |
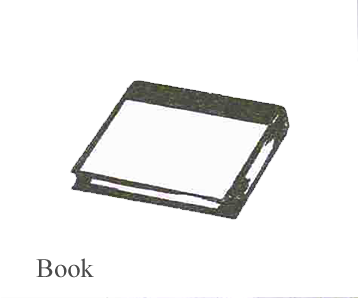
|

|
|
0 | 0 | |||||||
| 7 | Pakistan Muslim League (PML) |

|

|
8 | 0 | 7 | 0 | ||||||
| 8 | Allah-o-Akbar Tehreek (AAT) |
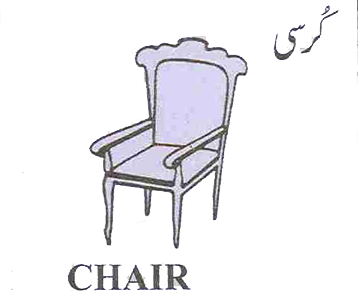
|

|
0 | 0 | ||||||||
| 9 | Pakistan Muslim League (Zia) (PML-Z) |

|

|
2 | 0 | 0 | |||||||
| 10 | Pakistan Awami Raj (PAR) |
|
|
0 | 0 |
This page shows comparative election results of political parties that contested Punjab Assembly seats in General Election 2018.
| Previous Election 2013 | Current Election 2018 |
|---|
| Party Position | Party Name | Symbol | Flag | Manifesto | Previous Election 2013 | Seat Won | Votes | % Vote Share | Current Election 2018 | Seat Won | Votes | % Vote Share | % Vote Change |
|---|---|---|---|---|---|---|---|---|---|---|---|---|---|
| 1 | Pakistan Tehreek-e-Insaf (PTI) |

|

|
|
20 | 0 | 121 | 0 | |||||
| 2 | Pakistan Muslim League (Nawaz) (PML-N) |

|

|
|
212 | 0 | 130 | 0 | |||||
| 3 | Independent (IND) |

|

|
42 | 0 | 30 | 0 | ||||||
| 4 | Tehreek-e-Labaik Pakistan (TLP) |

|

|
0 | 0 | ||||||||
| 5 | Pakistan Peoples Party Parliamentarians (PPPP) |

|

|
|
6 | 0 | 7 | 0 | |||||
| 6 | Muttahidda Majlis-e-Amal Pakistan (MMA) |

|

|
|
0 | 0 | |||||||
| 7 | Pakistan Muslim League (PML) |

|

|
8 | 0 | 7 | 0 | ||||||
| 8 | Allah-o-Akbar Tehreek (AAT) |

|

|
0 | 0 | ||||||||
| 9 | Pakistan Muslim League (Zia) (PML-Z) |

|

|
2 | 0 | 0 | |||||||
| 10 | Pakistan Awami Raj (PAR) |

|

|
0 | 0 |
