This page shows comparative election results of political parties that contested Khyber Pakhtunkhwa Assembly seats in General Election 2013.
| Previous Election 2008 | Current Election 2013 |
|---|
| Party Position | Party Name | Symbol | Flag | Manifesto | Previous Election 2008 | Seat Won | Votes | % Vote Share | Current Election 2013 | Seat Won | Votes | % Vote Share | % Vote Change |
|---|---|---|---|---|---|---|---|---|---|---|---|---|---|
| 1 | Pakistan Tehreek-e-Insaf (PTI) |
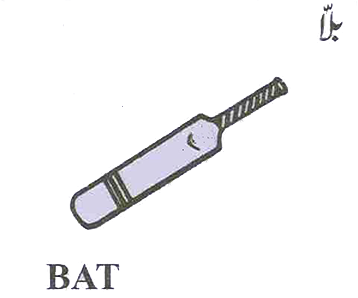
|
|
|
0 | 35 | 1,040,007 | 19 | |||||
| 2 | Independent (IND) |
|

|
22 | 828,317 | 24 | 14 | 867,842 | 16 | +4.77 | |||
| 3 | Pakistan Muslim League (Nawaz) (PML-N) |
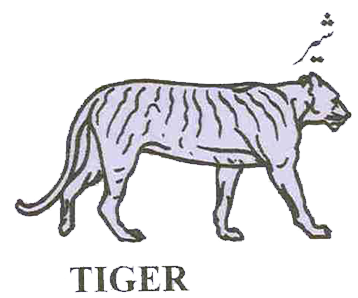
|
|
|
5 | 277,559 | 8 | 12 | 856,228 | 16 | +208.49 | ||
| 4 | Jamiat Ulama-e-Islam (Fazal Ur Rehman) (JUI) |
|

|
0 | 13 | 733,884 | 14 | ||||||
| 5 | Awami National Party (ANP) |
|
|
|
31 | 578,405 | 17 | 4 | 556,566 | 10 | -3.78 | ||
| 6 | Pakistan Peoples Party Parliamentarians (PPPP) |
|
|
|
17 | 563,057 | 16 | 3 | 473,358 | 9 | -15.93 | ||
| 7 | Jamaat-e-Islami Pakistan (JI) |
|

|
|
0 | 7 | 405,000 | 8 | |||||
| 8 | Qaumi Watan Party (Sherpao) (QWP) |
|
|
|
0 | 7 | 194,066 | 4 | |||||
| 9 | Awami Jamhuri Ittehad Pakistan (AJIP) |

|
|
0 | 3 | 63,497 | 1 | ||||||
| 10 | Mutahida Deeni Mahaz (MDM) |
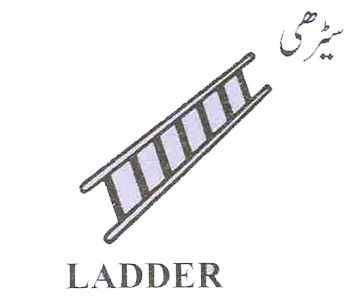
|

|
0 | 38,809 | 1 |
